

6 Salesforce Reports for Tracking Sales Team Productivity
13 Apr 2021
Table of Contents
There are some teams in every organization, which are highly data-driven, like your sales team. Every activity of the sales process is measurable, but the sales team usually faces challenges with what to track. With the proliferation of Salesforce reports, you now have more data at your disposal than ever before. This data can help you with sales team productivity tracking, but for that, you need to know the right metrics to track.
Sales analytics is the process to gain insights from sales trends, data, and metrics to set targets and predict future sales performance. The best way to work with sales analytics is to bring all activities together to set objectives for your sales team and determine revenue outcomes with reports.
Table of Contents
Salesforce Reports to Track Sales Team Productivity
Analytics helps the sales representatives work on the improvements and develop a strategy that could boost the sales performance in both the short- and long term. An example of such sales analytics activity is to set role-specific objectives for your team in the form of metrics and KPIs.
We’ve created a list to help with tracking reports with Salesforce so you can make informed decisions about your sales process, making it easier to grow your business and keep your pipeline full.
1. Lead Response Time
The longer the sales team takes to reply to a lead, the greater the chance of that opportunity slipping away from hands. Think like this- if a prospect is actively seeking out a solution and reaching out to the sellers, then you’re likely not the only business they’ve reached out to. In case your reps respond to a prospect in 24 hours, they may have already lost interest in you and connected with one of your competitors. So, those who respond to prospects quickly are more likely to qualify a lead and successfully seal the deal.
2. Conversion Rate
Your conversion rate or win rate is measured in the form of the percentage of leads that transform to become customers. To understand this better, suppose If you get approximately 500 leads per month, and on average 50 out of them buy your product, your conversion rate will be 10%. This metric can help you calculate the number of leads you need to achieve your revenue targets.
3. Sales Pipeline Coverage (SPC)
Sales Pipeline Coverage is the metric revealing whether your team has enough opportunities coming down the pipeline to make sales for a given period. SPC is calculated with the formula,
Pipeline Forecast / Sales Forecast = (Average Sales Days / 90 Days) * (1 / Close Rate)
Because not every opportunity will result in a sale, SPC can help you find out how many opportunities you need to have ongoing at any moment.
4. Sales Funnel Leakage
Measuring sales funnel leakage can help the sales team understand exactly where you lost the prospects in your funnel. You can determine your leaky points by tracking stage-by-stage conversion rates.
Suppose 40% of new prospects agree to a discovery call. Half of these prospects make it to the demo or trial stage. Just 5% end up buying. That steep drop-off indicates your salespeople are either not qualifying enough or negotiating poorly. When you know these issues, you can spend time observing them more closely to find out the true culprit.
5. Monthly New Leads
The new leads you achieve each month determine how many customers are available in your pipeline. Depending on your industry and business model, a lead is a user who downloads any particular piece of content, someone who reaches out to your sales team, or starts with a free trial of your software. You can know the average conversion rate for a particular month by regularly comparing your number of leads against your new customers
6. Revenue
At the end of the day, the report on the revenue made by the company is the most important one. While gross income might seem to be a simple metric – it’s the money you made during a specific timeframe, including discounts and returned products.
The revenue report includes the percentage of new business, upsell/ cross-sell/ expansion, and contract renewal.
Track it all with Salesforce Reports to Understand your Sales Process
Sales managers should start looking beyond revenue and look for the factors, which influence their team’s ability to succeed. Determining these weak points and improving them can help you to improve results dramatically. Reach out to our Salesforce consulting services and learn more about improving your sales process.
Categories

Solve It with Salesforce. We’ll Show You How.
AI. Apps. Experts. Everything you need to win with Salesforce under one roof.
About the author
Aditya KathpaliaAditya Kathpalia, Director of Sales at 360 Degree Cloud, brings over 35 years of experience in marketing and business development within the IT industry. He leads global sales strategies, builds strategic partnerships, and fosters client relationships across geographies, ensuring mutual growth in customer transformation journeys. With a strong focus on driving results and motivating teams, Aditya plays a key role in positioning 360 Degree Cloud as a trusted Salesforce Summit Partner worldwide.
Recent Blogs
 Hire Staff
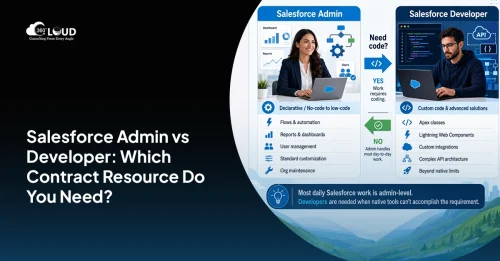
Salesforce Admin vs Developer: Which Contract Resource Do You Need?
When you hire a Salesforce admin on contract, the expert configures, automates, and maintains Salesforce using the platform’s built-in declarative tools – Flows, Process Builder,…
Read More Products
Stop Losing Deals to Slow Follow-Up with Salesforce SMS for Financial Services
Banks and lenders lose more deals to slow follow-up than to customer indecision. A borrower who asked about rates on Tuesday and hasn’t heard back…
Read More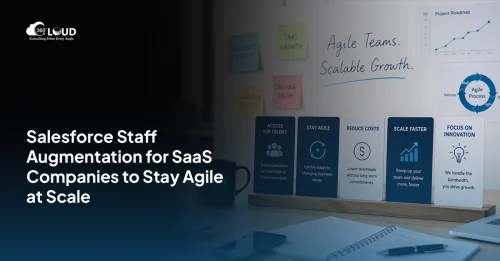 Hire Staff
Salesforce Staff Augmentation for SaaS Companies to Stay Agile at Scale
SaaS companies need Salesforce staff augmentation built around SaaS-specific revenue models, subscription, usage-based, expansion, seat-based, not generalist developers applied to a SaaS context. General Salesforce…
Read MoreReady to Make the Most Out of Your Salesforce Instance?
Our Salesforce aces would be happy to help you. Just drop us a line at contact@360degreecloud.com, and we’ll take it from there!
Subscribe to our newsletter
Stay ahead with expert insights, industry trends, and exclusive resources—delivered straight to your inbox.