

If you are an active Salesforce user, it would be common for you to use Salesforce Reports to view the data of your business. When you do so, it would only show you the most recent data. But what if you want to see any previous records?
There can be times when you want to analyze how data is changing over time, which could be from last few quarters, weeks, or months. That’s where you would need Reporting Snapshot to make it possible.
What is Salesforce Reporting Snapshot?
Salesforce Reporting Snapshots allow you to report on historical data, enabling you to work with report data just the way you work with other records in Salesforce.
Reporting snapshots act as data compilations focusing on historical trends, rather than current opportunities.
They automatically capture and store data sets at predefined intervals, and generate reports, which can be called “snapshots,” that helps with ongoing analysis and comparison.
There are three basic elements of reporting snapshots:
A source report
A Custom Object that has matching fields to the columns of source report
A Reporting Snapshot definition that matches fields to one another and coordinates the snapshot “runs,” or time frames in which the snapshot is operational
Why You Should Use Reporting Snapshot
Though, it’s clear that you need Reporting Snapshot to analyze and compare previous records, there are some more use cases that justify using the feature.
1. Monitor Forecast Accuracy
Reporting snapshots offer you a window into the level of accuracy regarding current team forecasting. You’ll get analyzed reports filtered by team, or individual salesperson that can help you provide increasingly granular perspective on where the forecast is hitting the target
2. Track Changes in Your Sales Pipeline
We all know nature of a sales pipeline is potentially volatile.
Neatly organized historical data compiled from reporting snapshots can help you to stay ahead of the curve when market’s needs or expectations keep changing.
Moreover, data acquired from snapshots can also help you to readily spot inefficiencies that exist within the sales process. As an example, you can filter reports on the basis of geographic location to determine high-yield regions versus low-performing regions.
3. Acts as a Compelling Evidence for Proposals
Whether it’s a recommendation that you have to make to a customer or want to make a call, snapshot-sourced reports can help executives and marketing managers understand the current state of affairs, and determine the best decision going forward.
4. Track Changes by an Account or a Case
Salesforce Reporting Snapshots keeps running historical tab on even individual cases, or accounts. This feature can be extremely helpful when you are managing essential B2B accounts.
It can also help you conduct more segmented analysis that can provide details related to many important measurements of sustainability and performance like:
Engagement rate related to each department
Trends in purchase categories
Product return and/or complaint rates along with positive engagements
How to Create a Reporting Snapshot in Salesforce
To create a Reporting Snapshot in Salesforce, you have to follow three main steps.
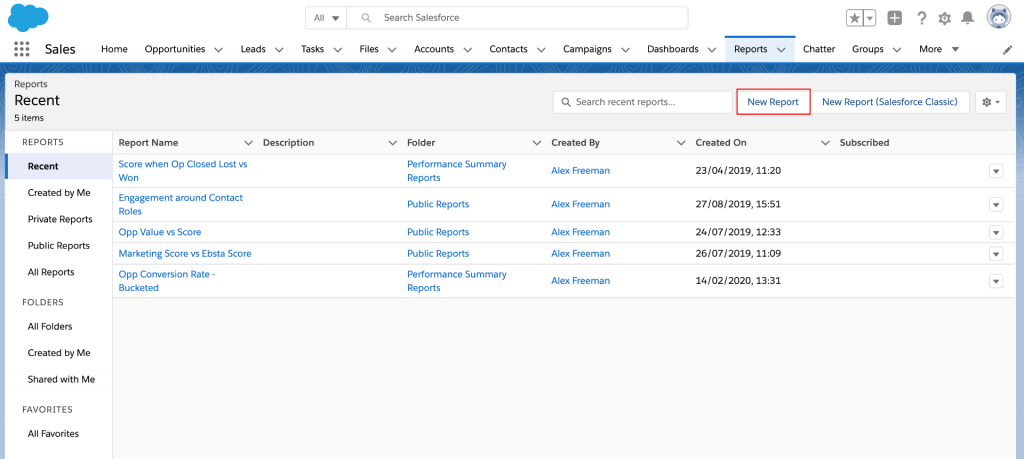
Step 1: Create a new report
Create a New report by going to Reports. Select New Report.
Choose the Report type you want to use.
Select the ‘Opportunity’ Object. Click ‘Create’.
Drag in the columns that you want to monitor.
Click ‘Run Report’.
Step 2: Create a New Custom Object for Storing the Data
Create a Custom Object by going to Setup. Click Create, then Objects, and select New Custom Object.
Give a name to your Custom Object. Make sure the “Allow Reports” and the “Deployed” option are both checked.
Click Save In your Custom Object.
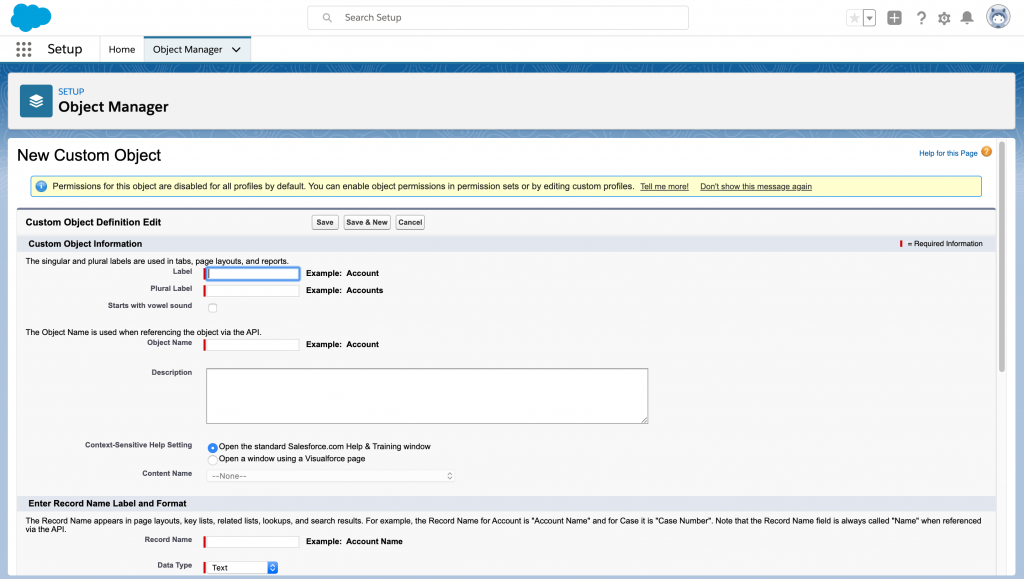
Create Custom Fields to hold the data from your source report. Make sure you give your Custom Fields the same names as the columns in your source report. Click New under Custom Fields & Relationships.
Step 3: Create an Automation Job
Go to Setup and enter “Reporting Snapshots” in the Quick Find box. Select Reporting Snapshots.
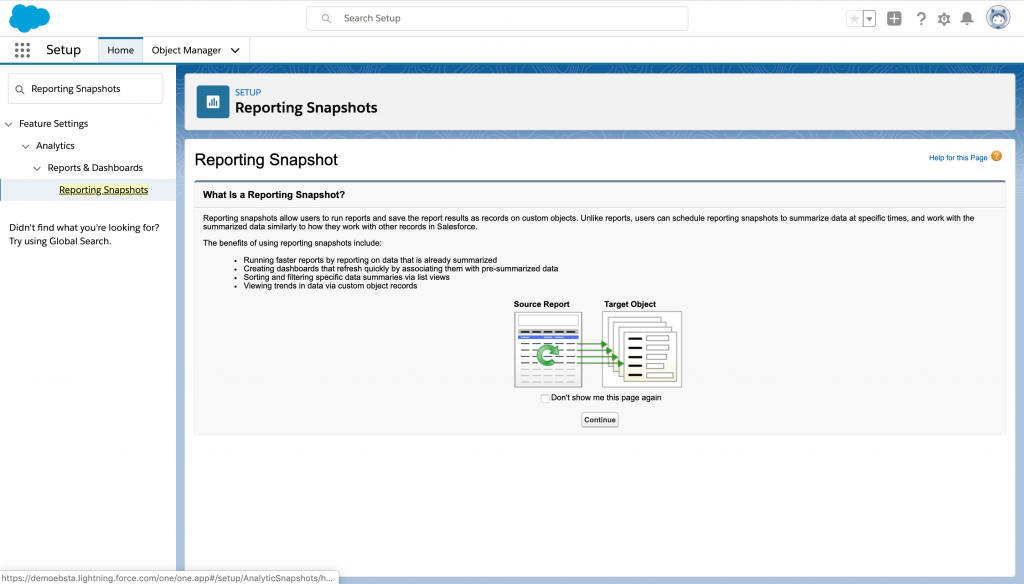
Give a name to your Analytic Snapshot. The Running User should have the permission to view and report on the data that you’re going to push into your custom object.
Choose the Source Report and Custom Object, you created recently from the Source Report and Target Object drop-down list.
Click Save & Edit Field Mappings Map the columns from your source report to the right fields. Hit Save.
Click on Edit under Schedule Reporting Snapshot to choose the frequency and the time you wish for your Source Report to run.
That’s a Wrap
Using Salesforce Reporting Snapshots is only one piece of the puzzle, but it’s an essential step when you want to leverage data analytics successfully to yield actionable insights and respond to trends in the sales cycle.
We’ve already provided you with a PDF above so you can set up your Reporting Snapshot easily and encourage you to optimize sales operations with trend analysis. A greater understanding of your own trends should help you double down on your key revenue drivers.
Awards & Accolades


Got a Question? Ask Us!
Ready to Solidify Your Digital Transformation Efforts Using Salesforce? Talk to Us!

Subscribe to our newsletter
Stay ahead with expert insights, industry trends, and exclusive resources—delivered straight to your inbox.